library(tidyverse)
df<-data.frame(month=rep(month.abb,each=3),class=c('A','B',"C"),value=runif(36))
head(df)数据准备
ggplot(data=df,aes(x=month,weight=value,fill=class))+
  geom_bar(position = 'stack')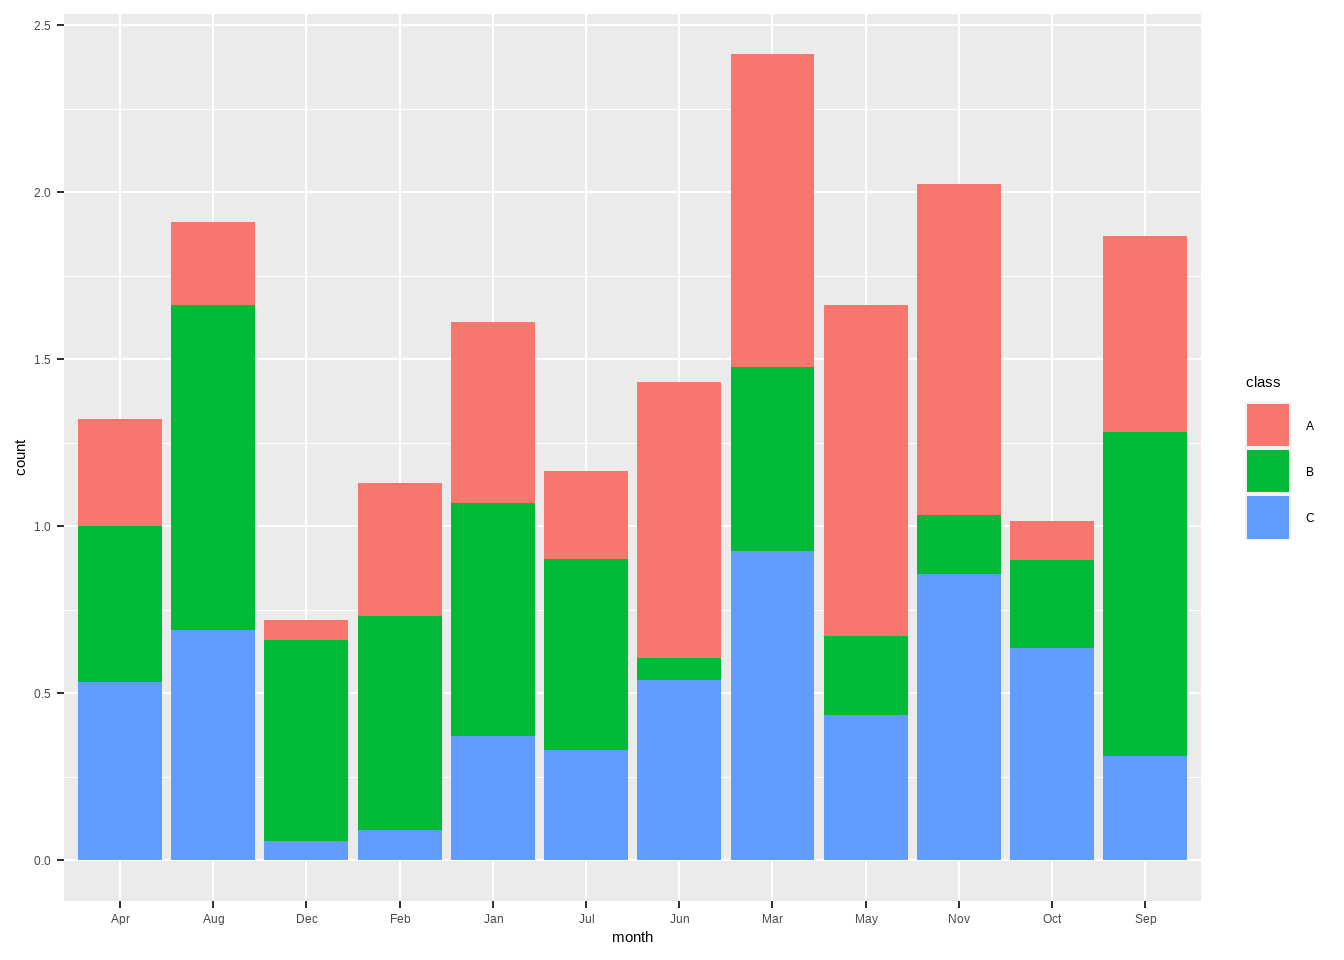
ggplot(data=df,aes(x=month,y=value,fill=class))+
  geom_col(position = 'stack')
ggplot(data=df,aes(x=month,weight=value,fill=class))+
  geom_bar(position="dodge")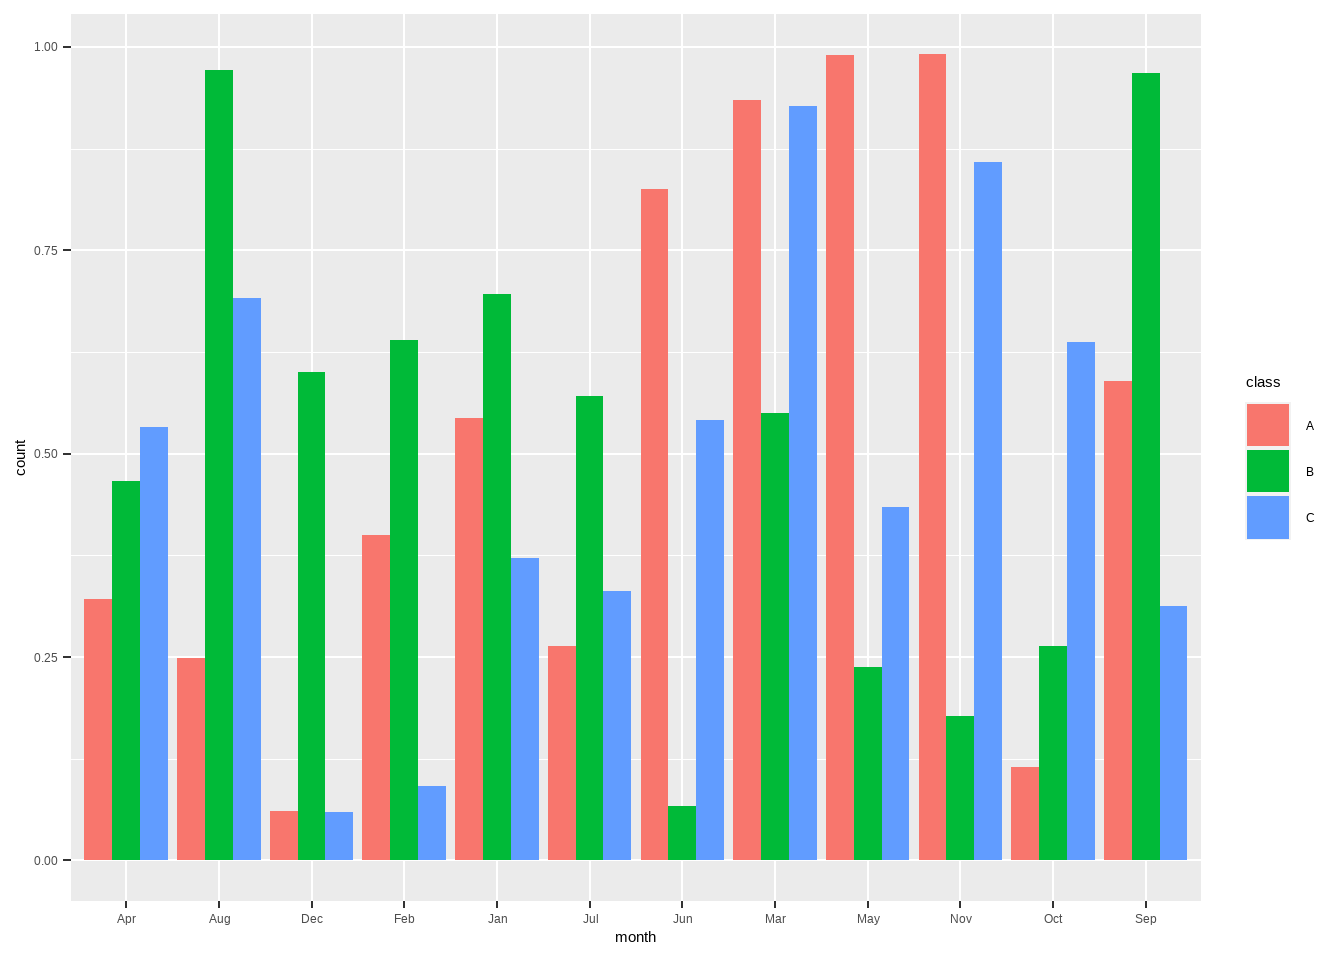
ggplot(data=df,aes(x=month,weight=value,fill=class))+
  geom_bar()
有序列表
df.2 <- df %>%
  mutate(month=ordered(month,levels=month.abb),
class=ordered(class,levels=c("A","B","C")))p<-ggplot(df.2,aes(month,value,fill=class))+
geom_col()
p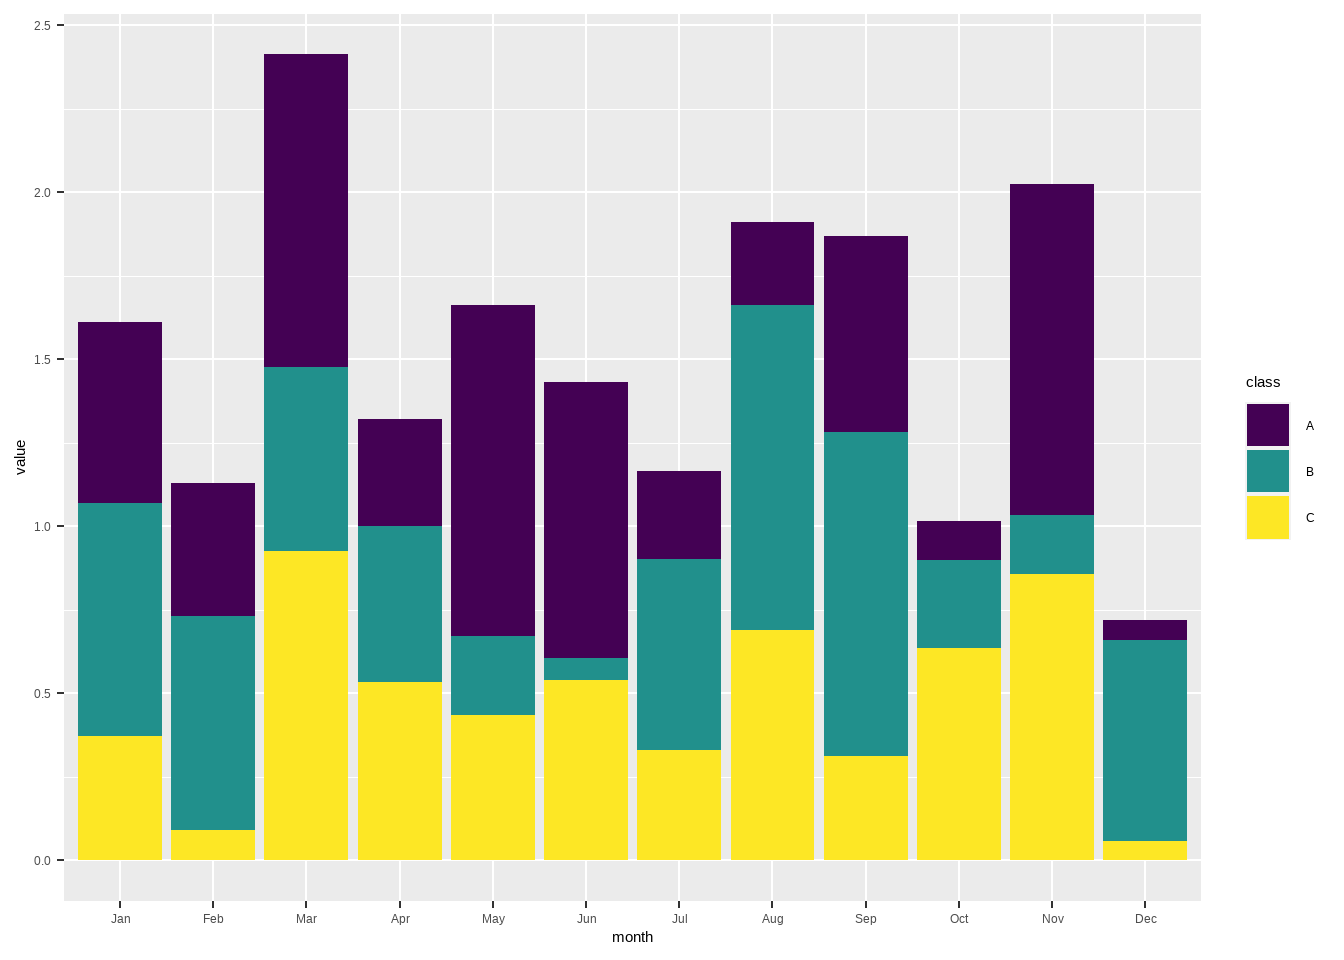
样式修改
p+theme_classic()+
  scale_fill_brewer(palette = "Set1")
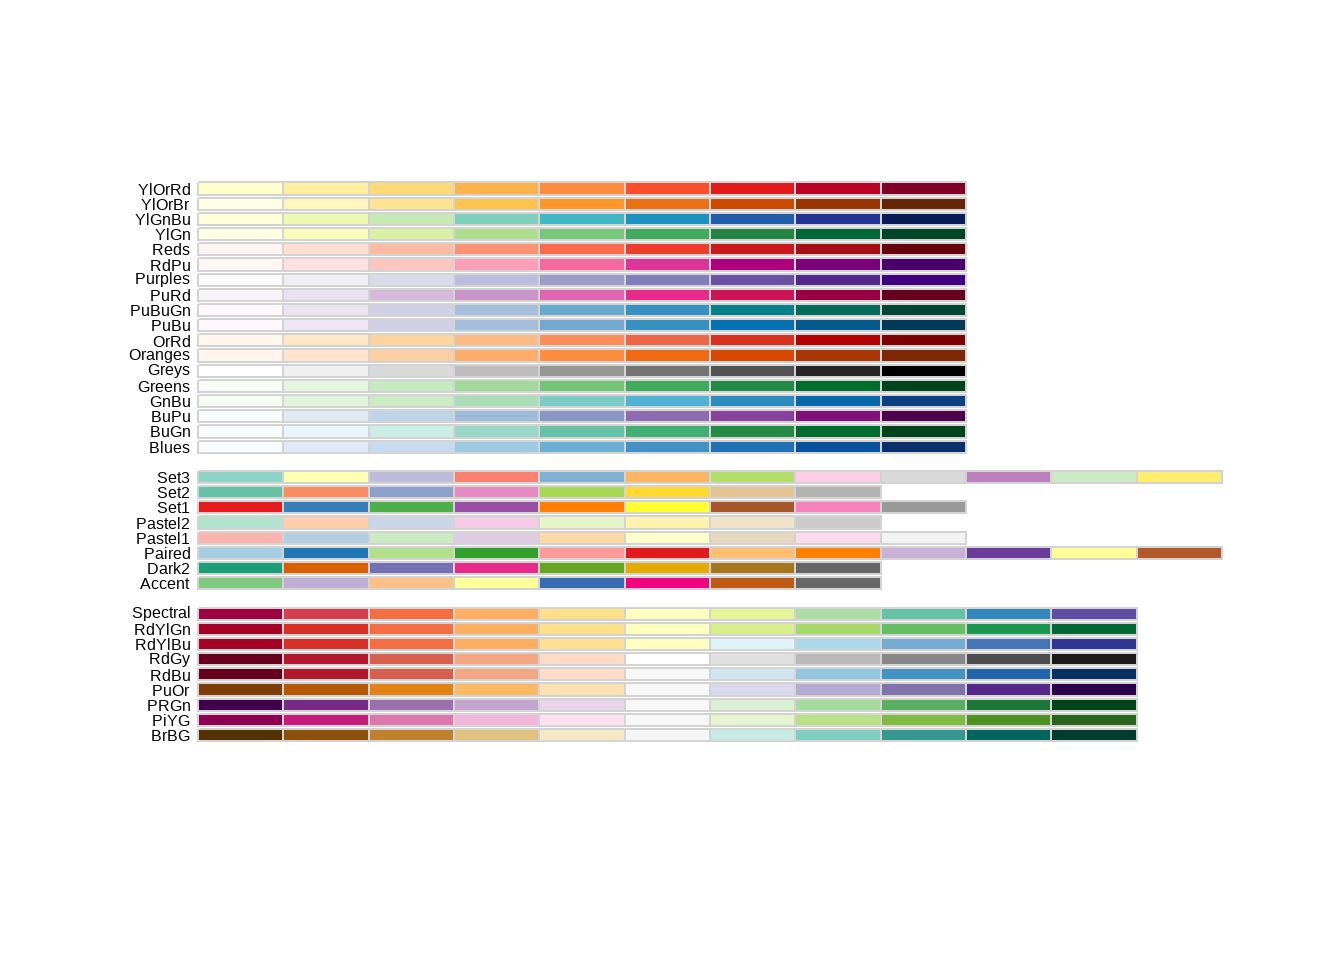
library(RColorBrewer)
display.brewer.all()