#install.packages('tidyverse')
library(tidyverse)mtcarsggplot(mtcars,aes(mpg,disp))+
geom_point()+
theme_bw()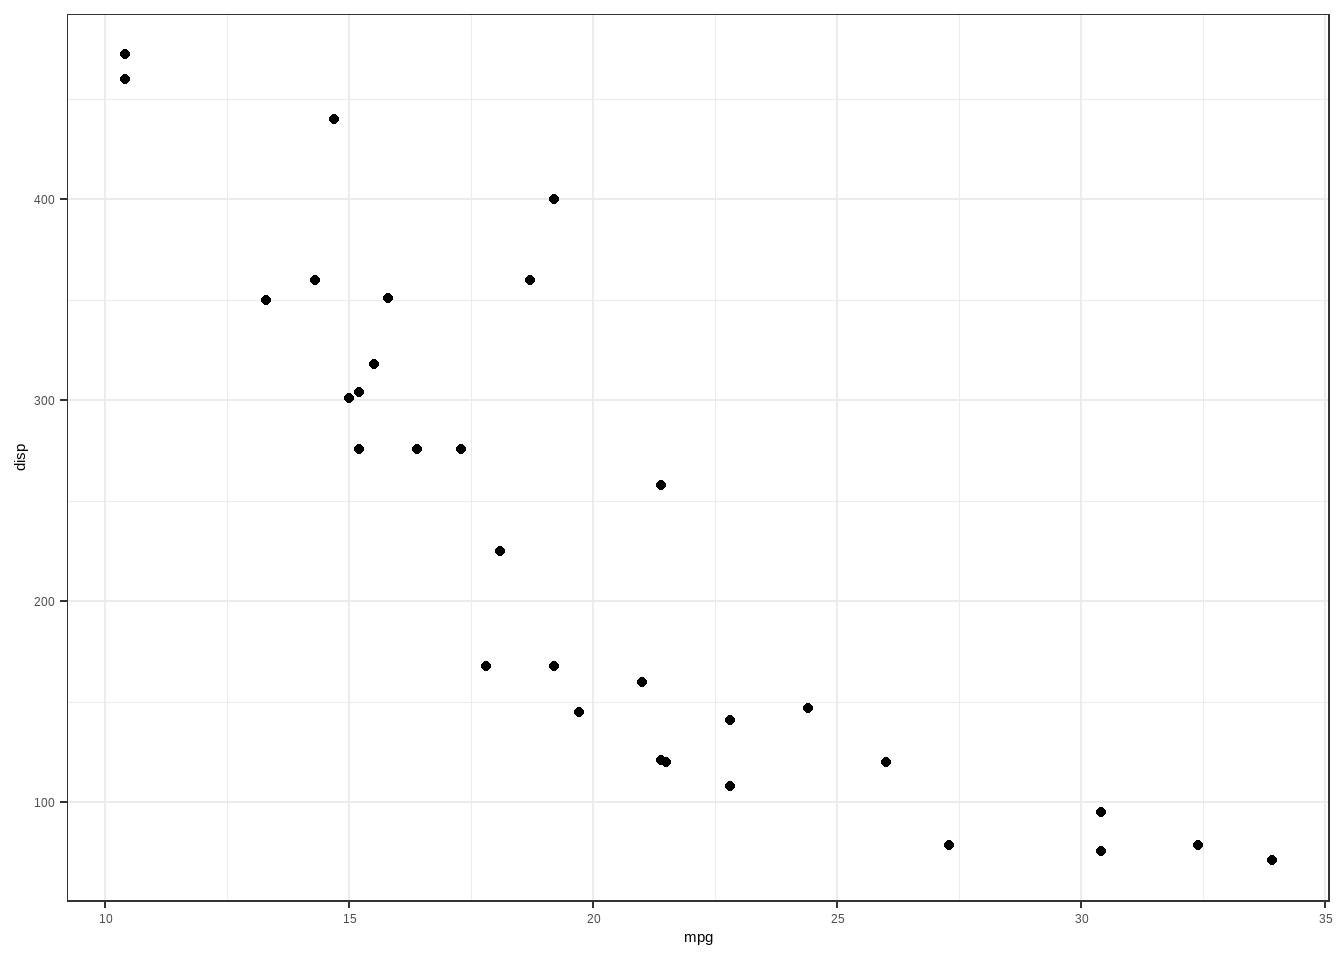
柱状图
简单柱状图
ggplot(mtcars, aes(x=factor(carb))) +
  geom_bar()+
  theme_bw()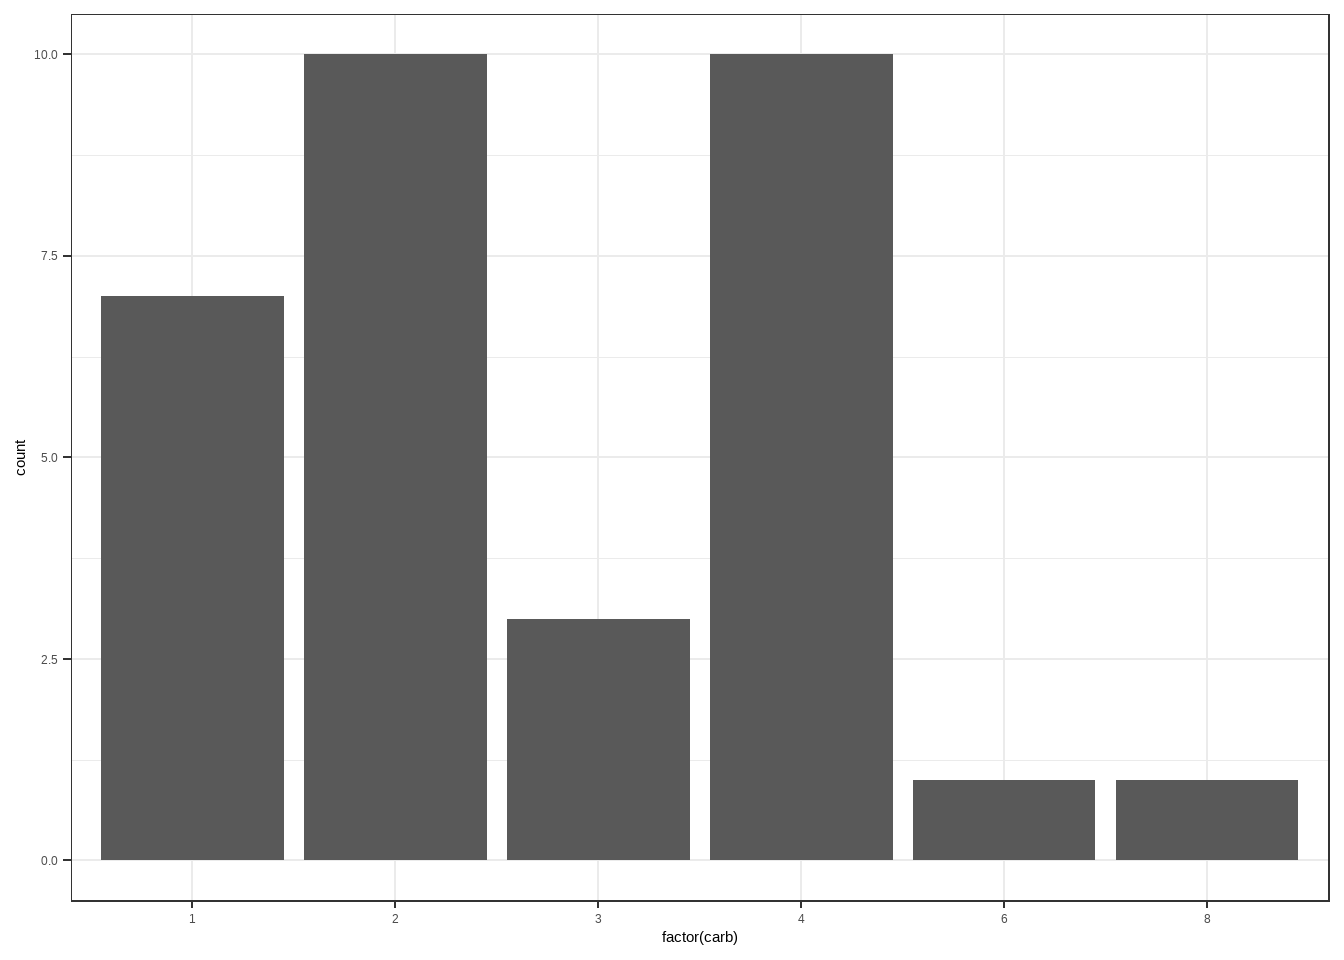
ggplot(mtcars, aes(x=fct_infreq(factor(carb)))) +
  geom_bar()+
  theme_bw()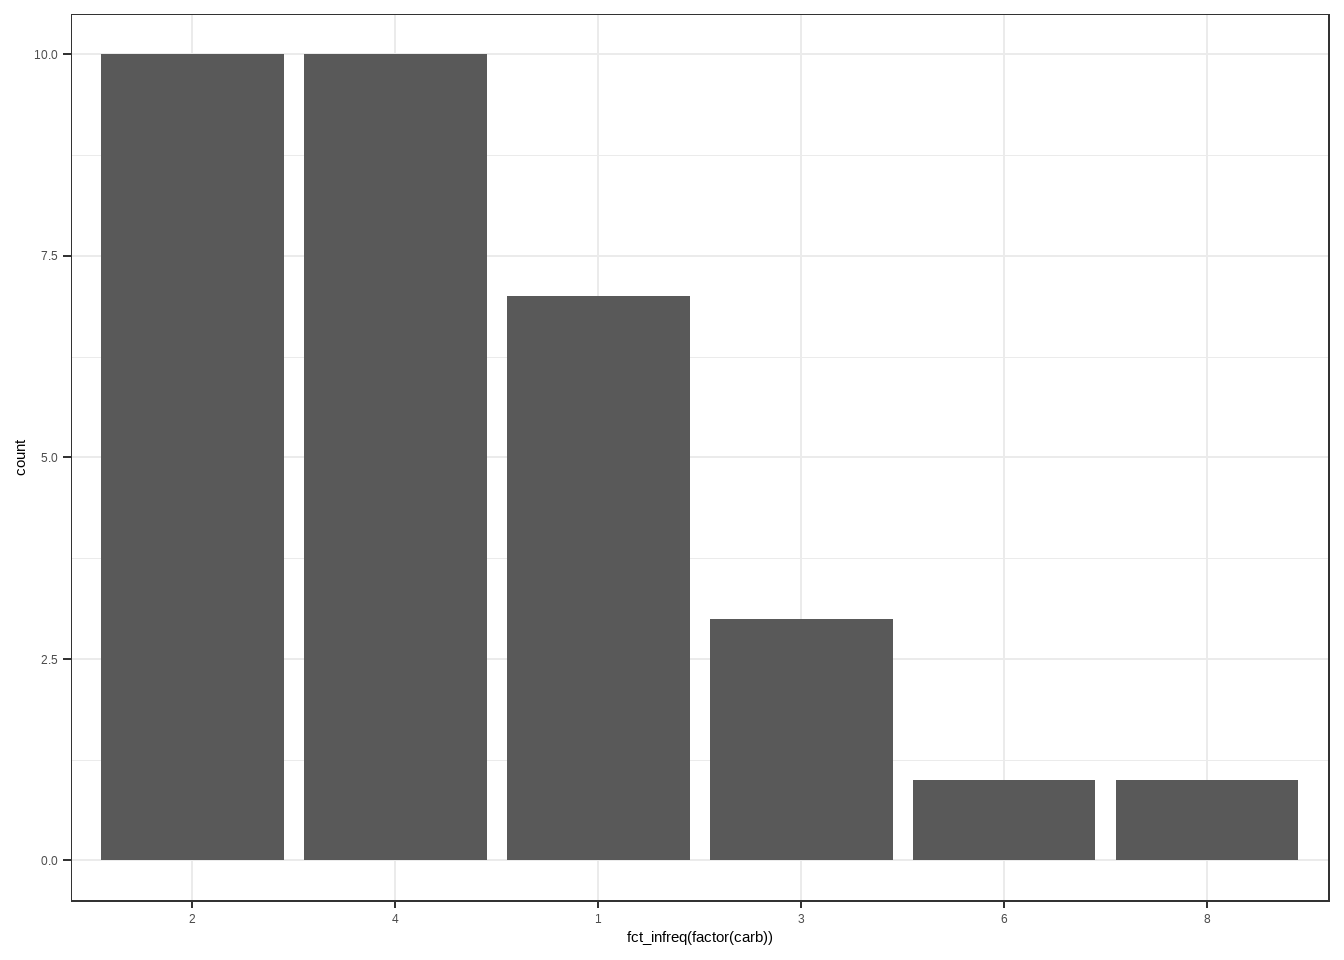
主题
坐标轴名称
ggplot(mtcars,aes(mpg,disp))+
  geom_point()+
  labs(title = 'title',subtitle = 'subtitle',caption = 'caption',tag = 'A',x='X',y='Y')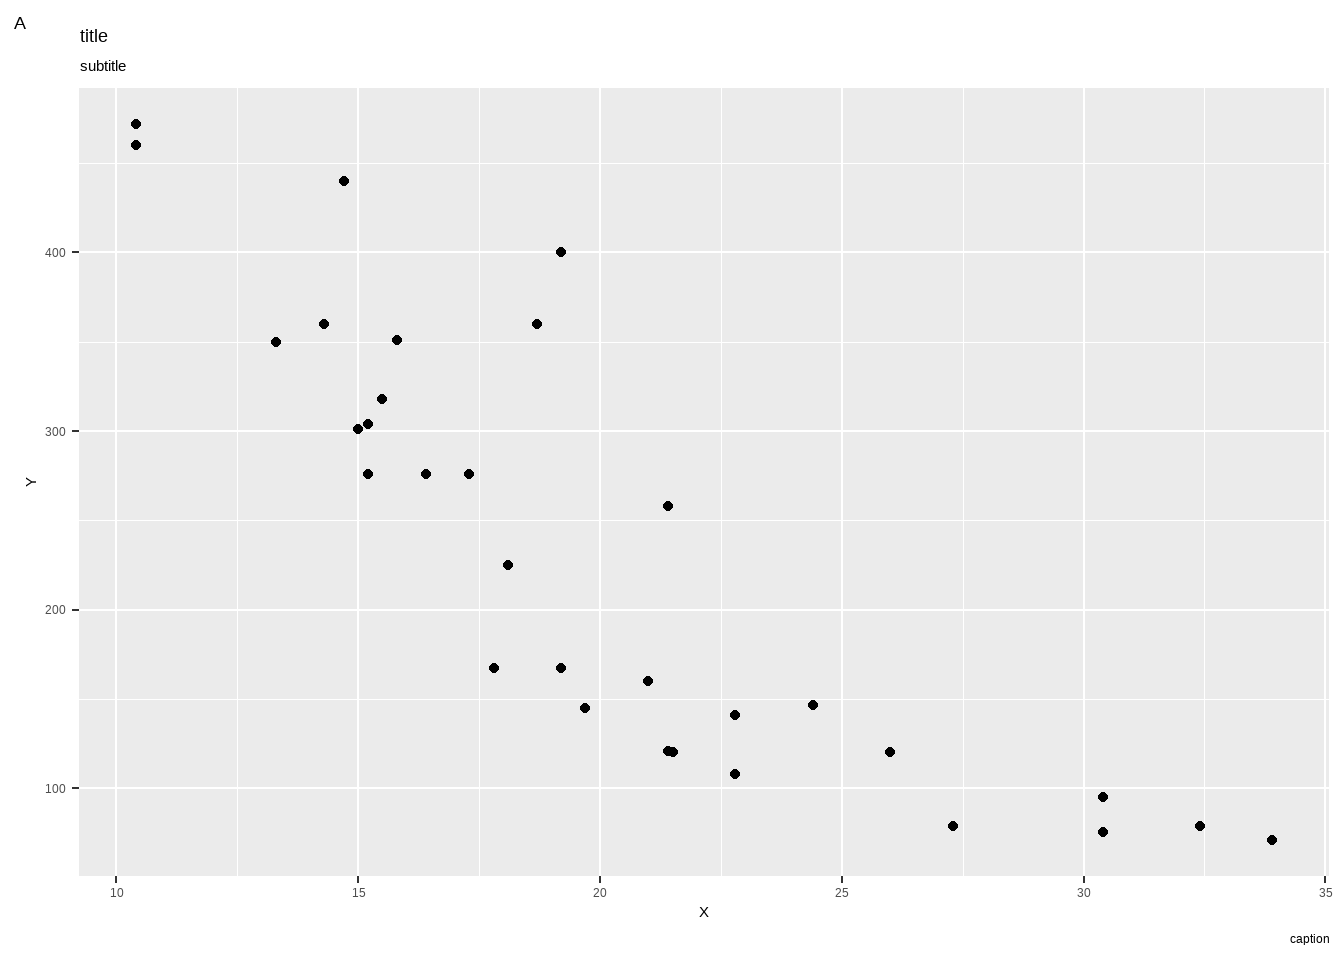
主题
p<-ggplot(mtcars,aes(mpg,disp))+
  geom_point()+
  geom_smooth()
p+theme_bw()
p+theme_minimal()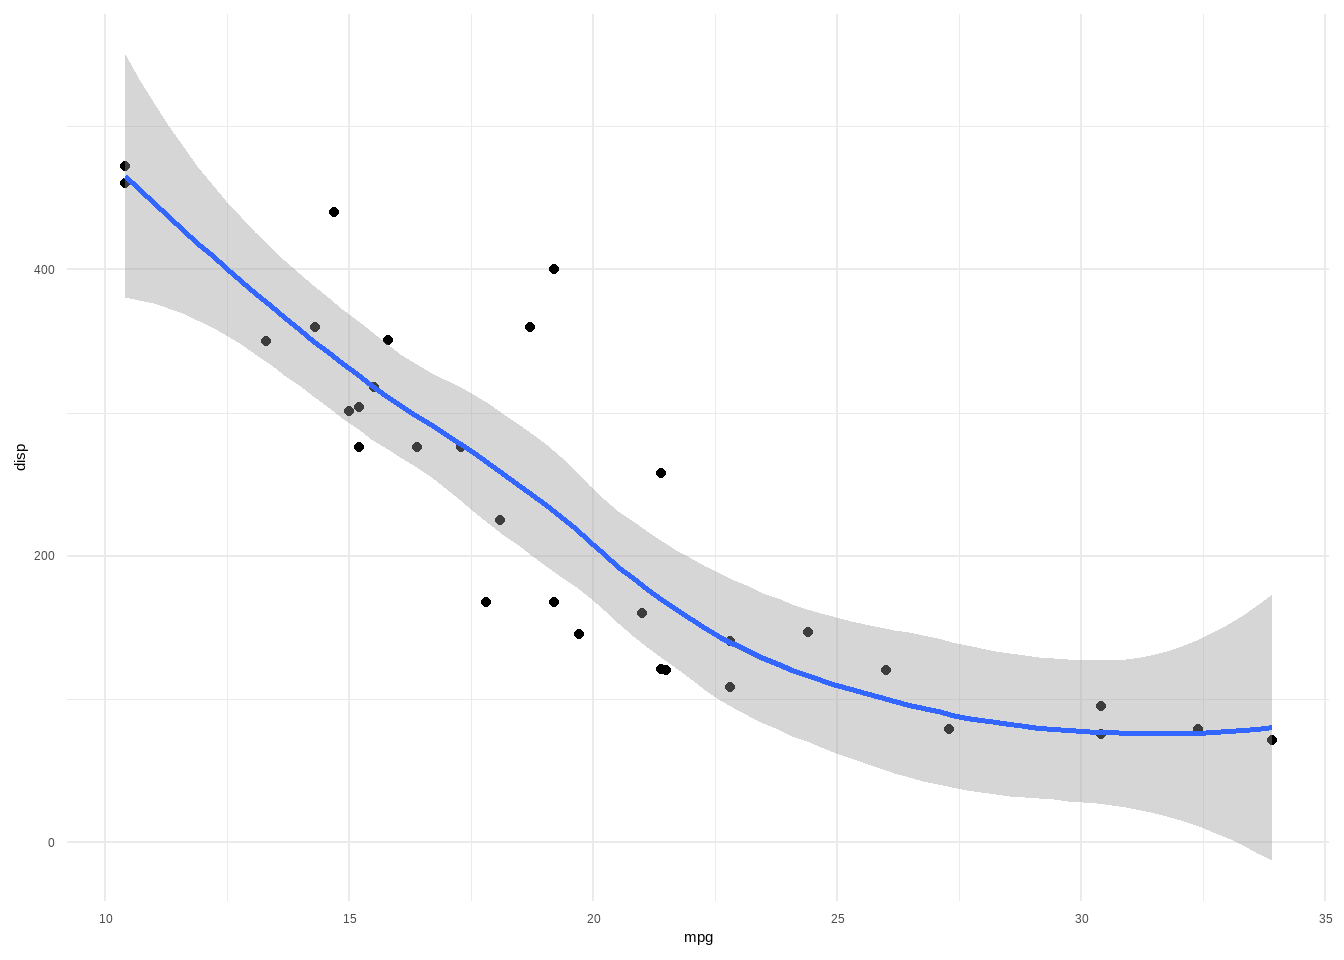
p+theme_classic()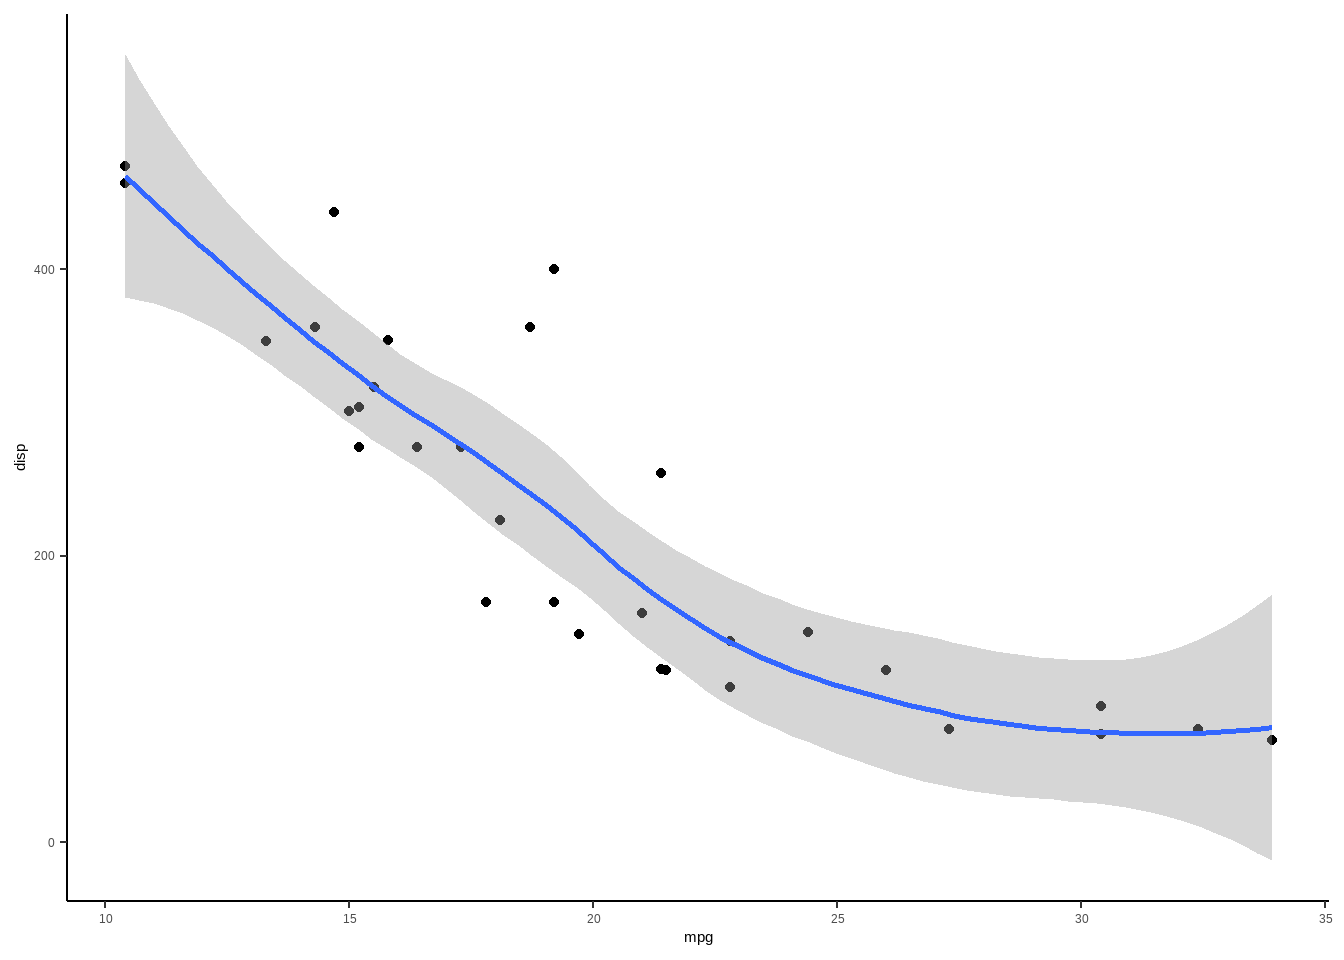
p+theme_dark()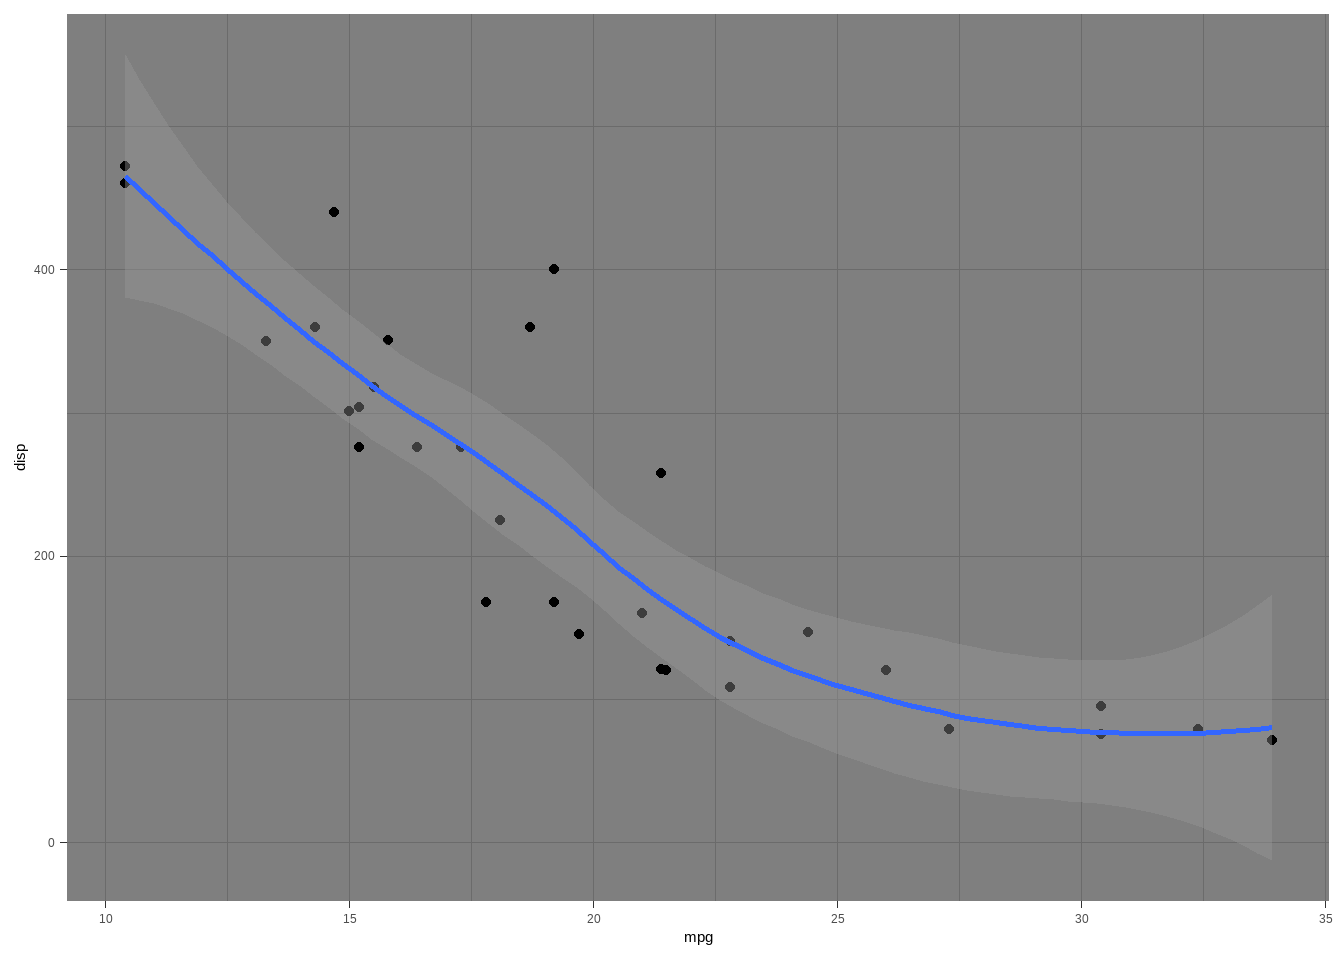
p+theme_light()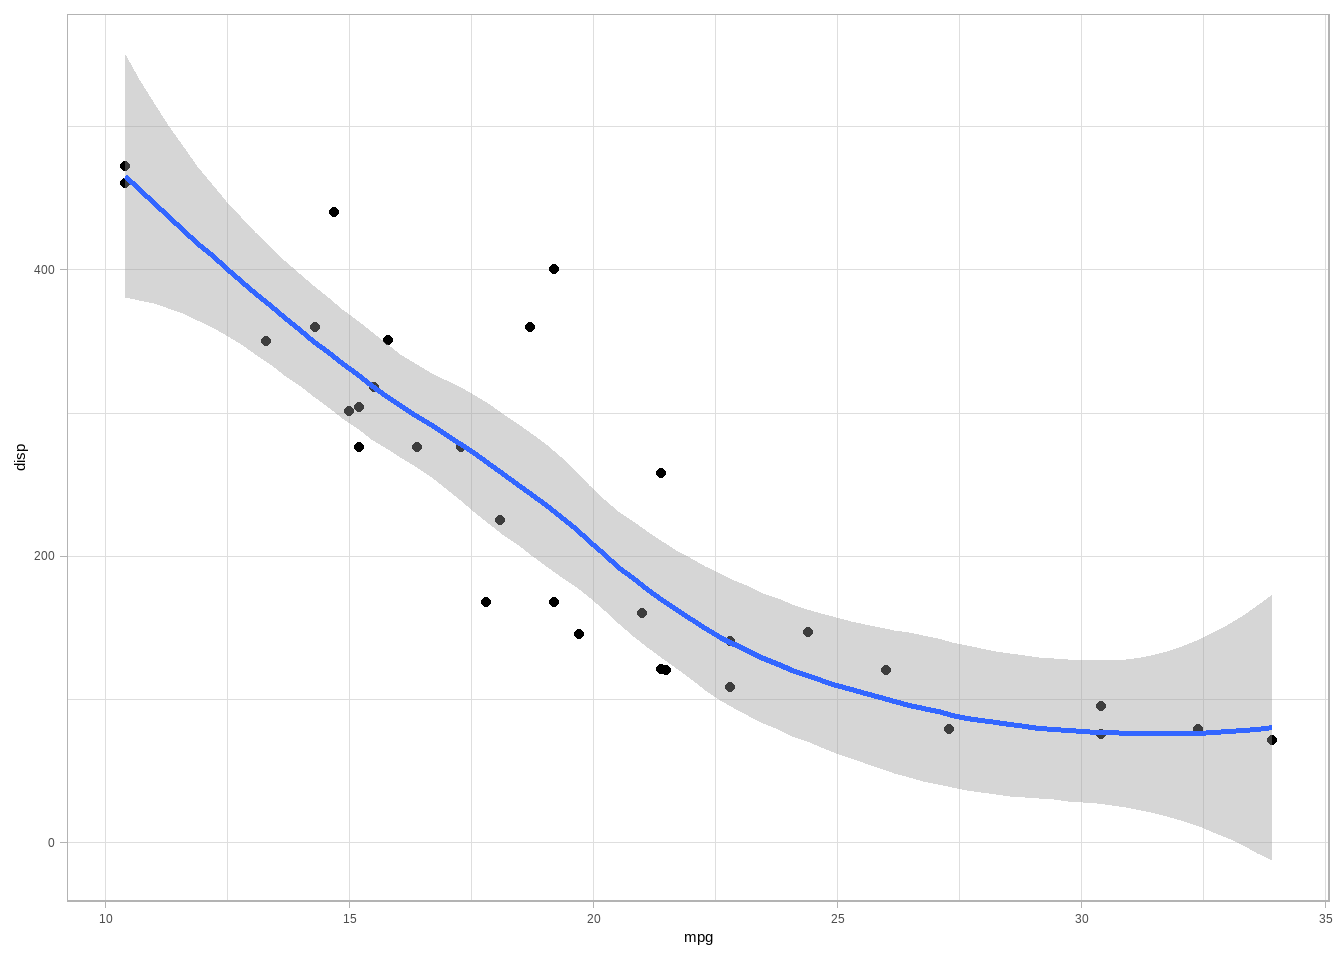
p+theme_gray()
p+theme_grey()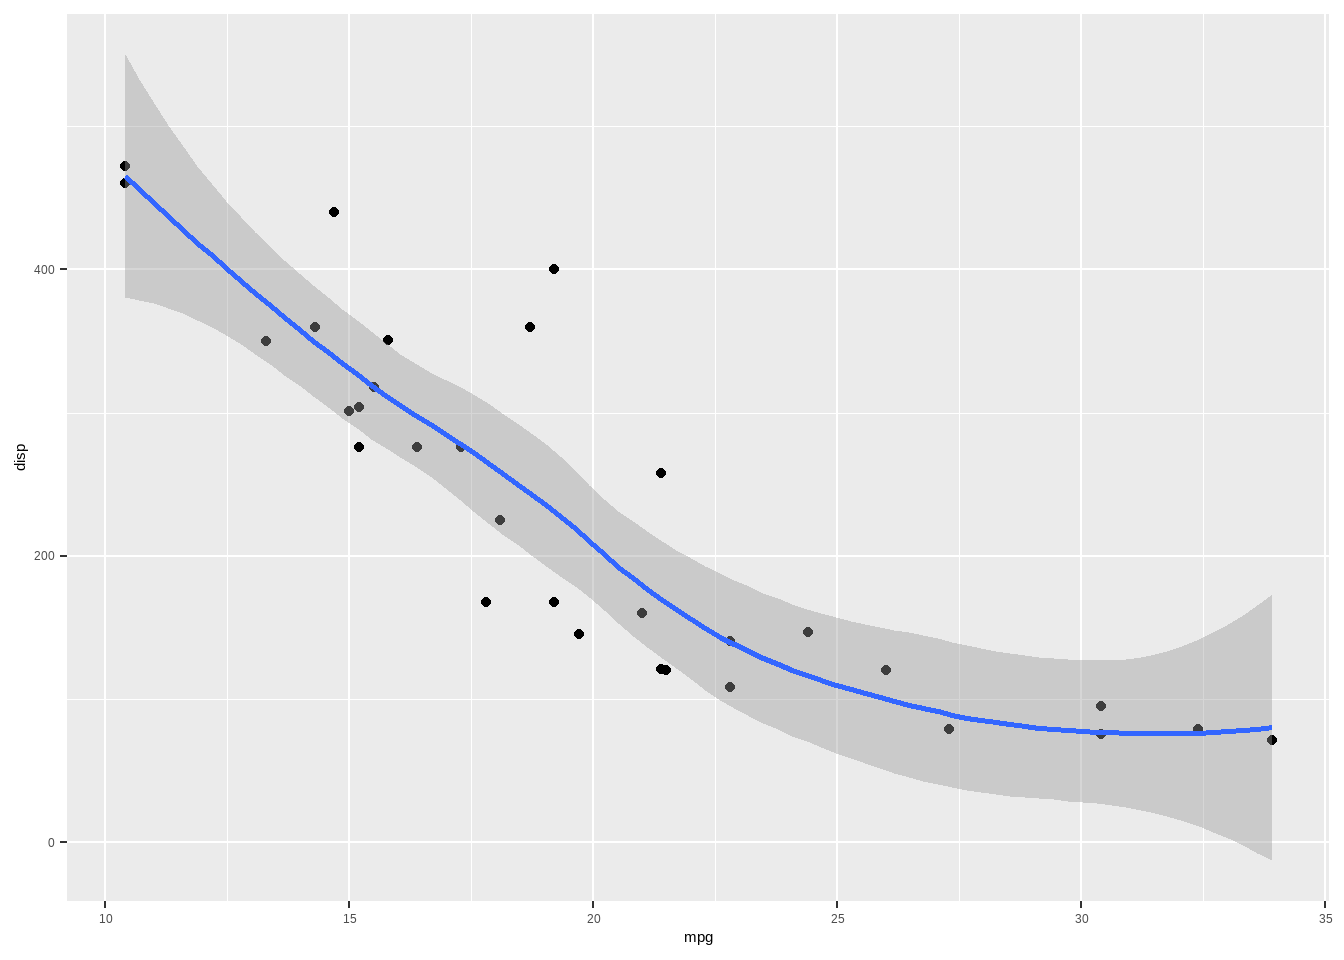
p+theme_void()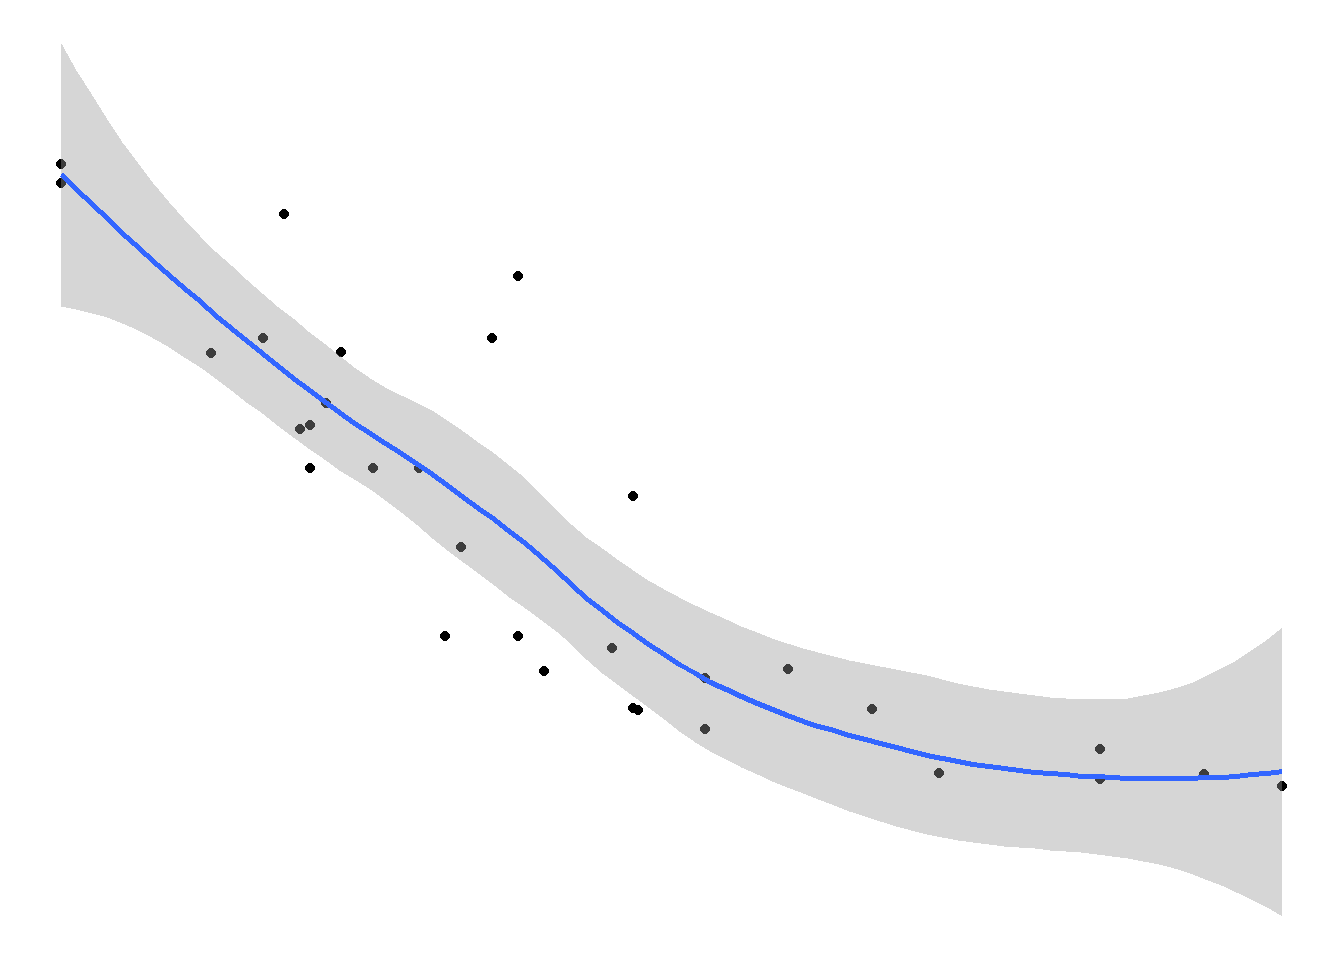
df<-tribble(~category,~group,~value,
            'A','g1',10,
             'A','g2',20,
             'B','g1',10,
             'B','g2',20)
ggplot(df,aes(category,value,fill=group,label=value))+
  geom_col(width=0.4,position = position_dodge(width=0.5))+
  geom_text(width=0.4,aes(y=value+1),position = position_dodge(width=0.5))+
  theme_bw()+
  scale_y_continuous(expand = expansion(c(0,0.1),c(0,0)))+
  labs(x='X',y='Y',fill='legend')+
  scale_fill_manual(values = c('skyblue','pink'))+
  theme(legend.position = 'top')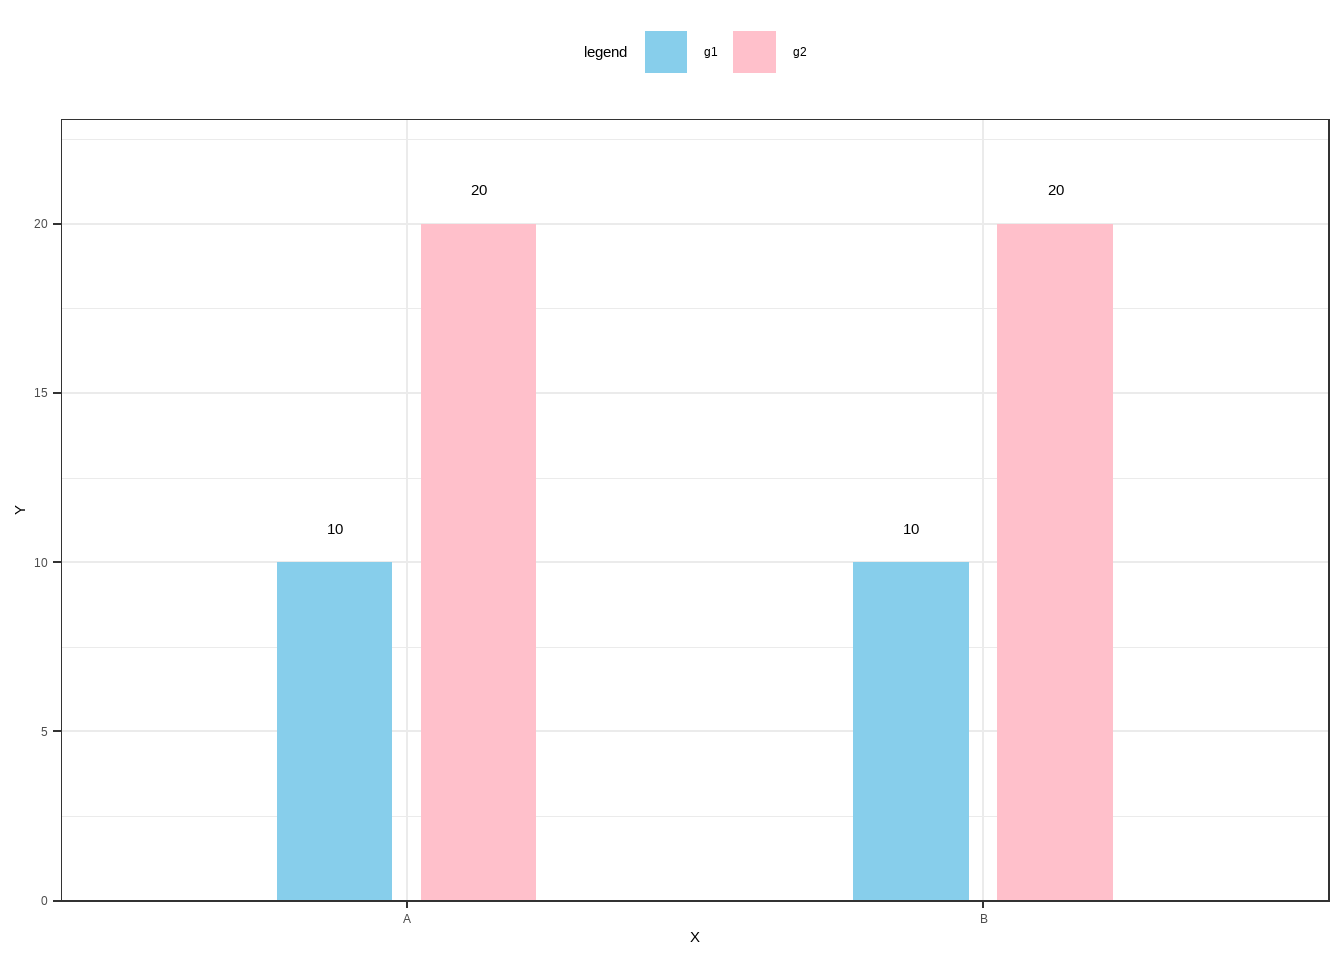
df<-data.frame(x=letters[1:10],y=runif(10),size=runif(10))
ggplot(df,aes(x,y))+
  geom_point(color='red')+
  geom_point(aes(size=size),alpha=0.5,color='red')+
  theme_bw()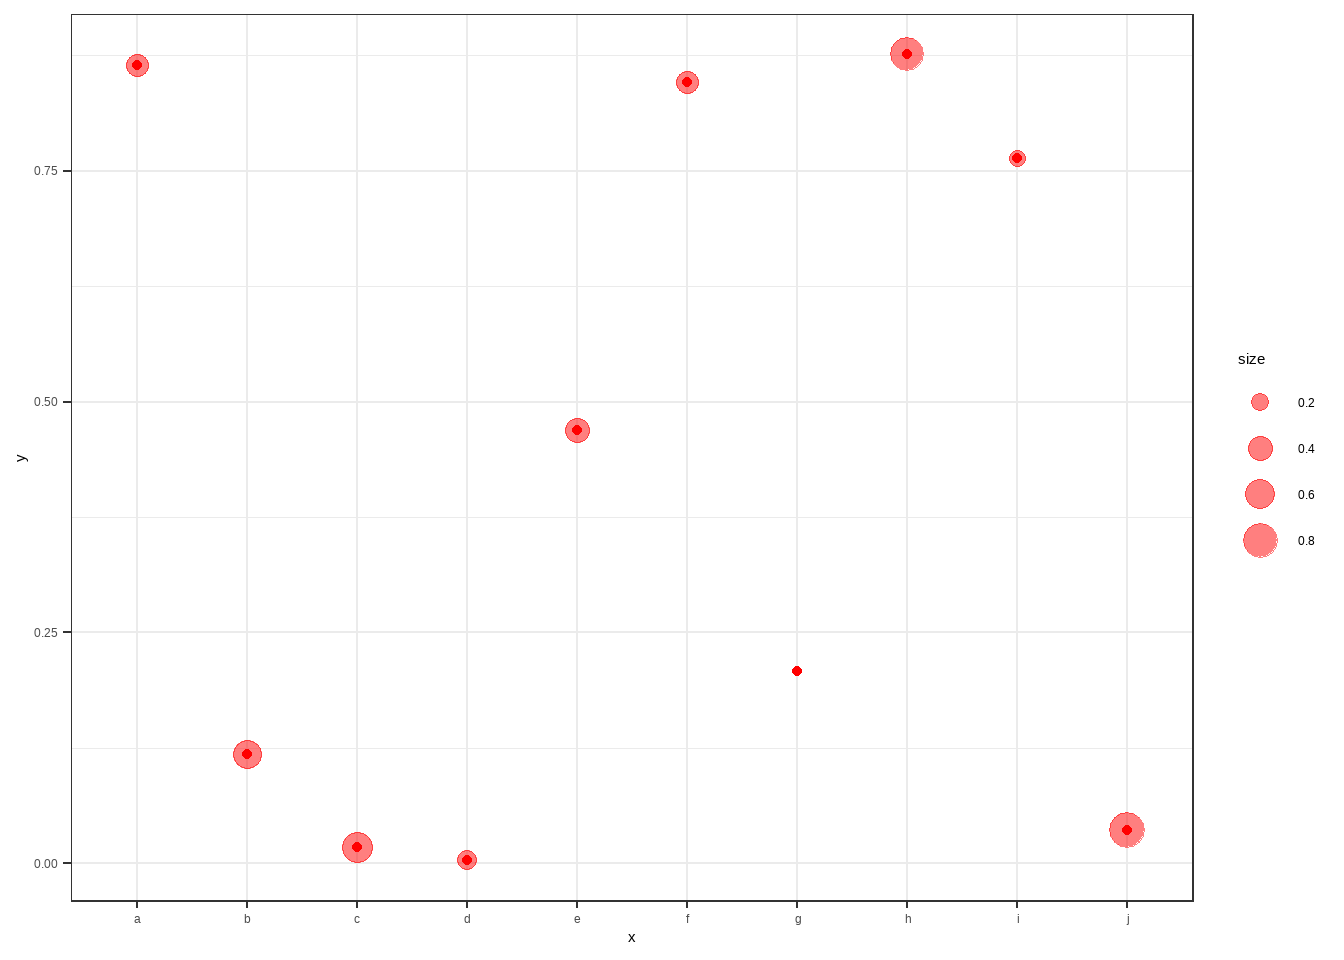
ggplot(mtcars,aes(mpg,disp))+
  geom_point()+
  geom_smooth(method = 'lm',color='blue',fill='skyblue')+
  theme_bw()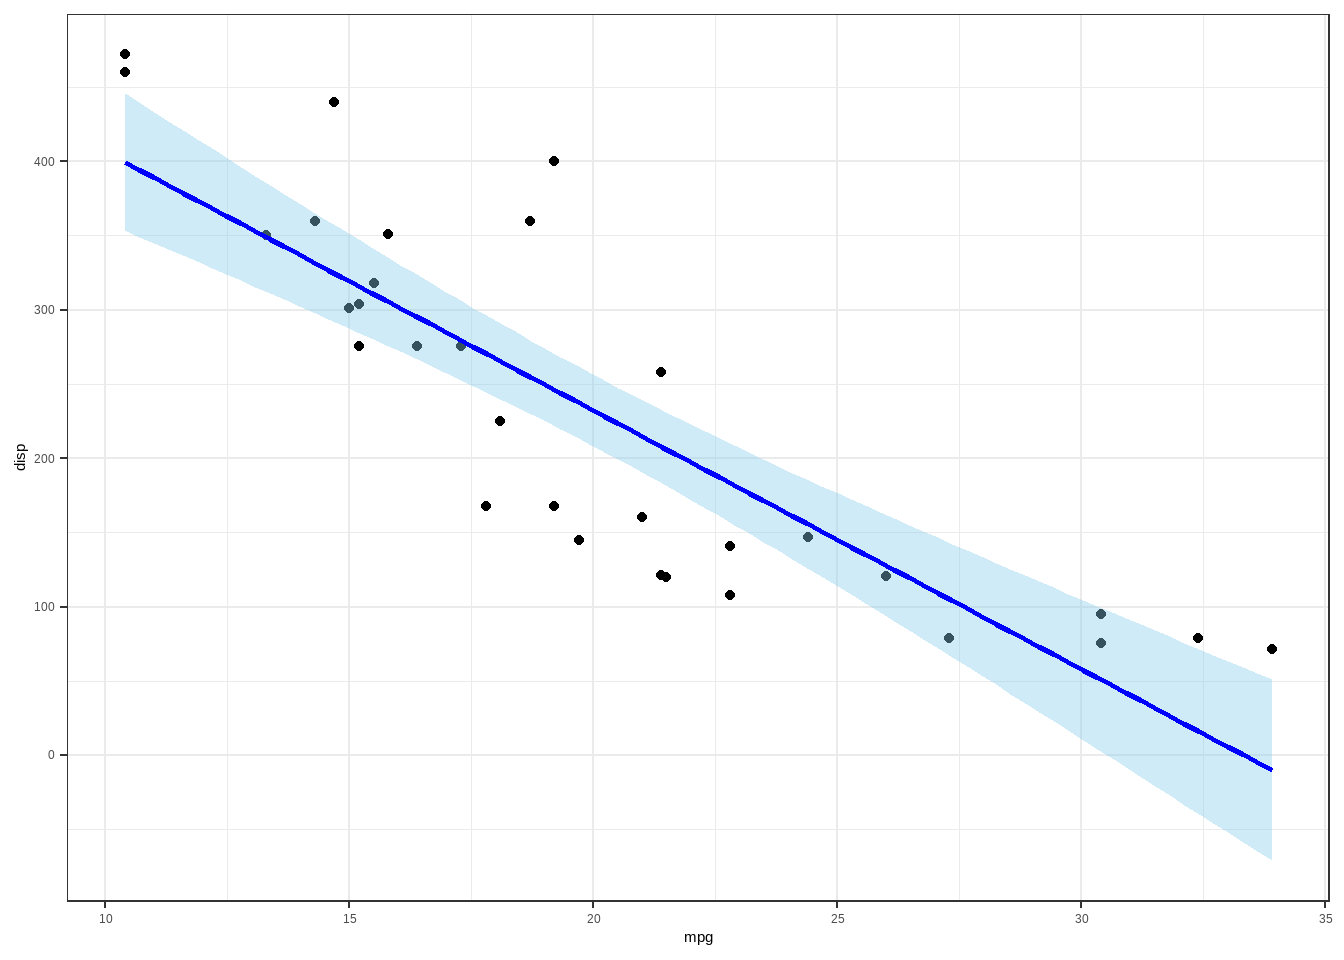
ggplot(mtcars,aes(mpg,disp))+
  geom_point()+
  geom_smooth(method = 'loess')+
  theme_bw()
#棒棒糖图
df<-count(diamonds,cut)
dfggplot(df,aes(cut,n,color=factor(cut)))+
geom_point(size=5)+
geom_segment(aes(x=cut,xend=cut,y=0,yend=n),size=2,alpha=.5)+
theme_bw()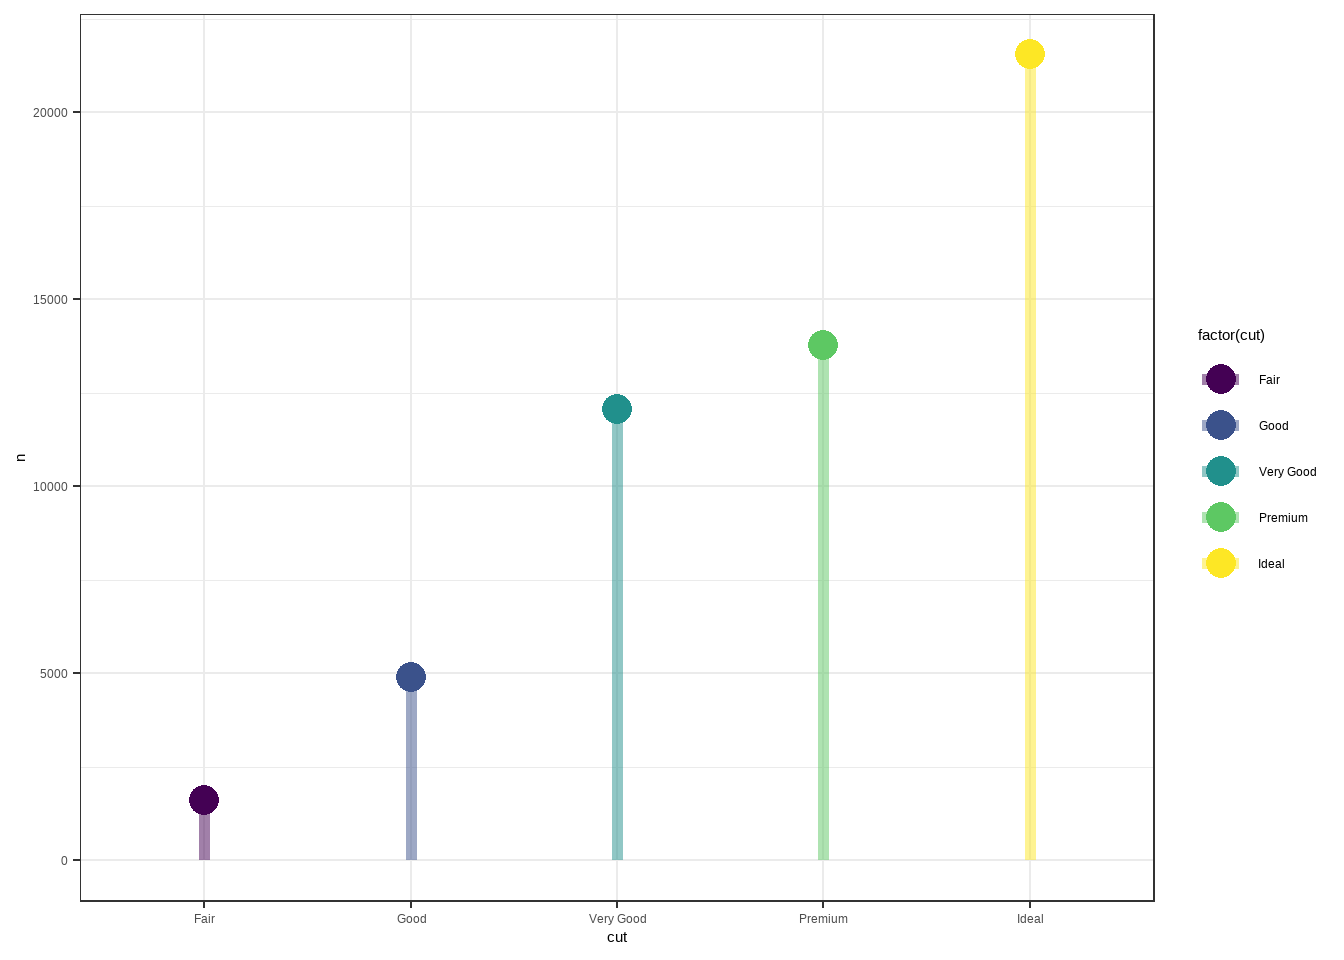
#棒棒糖图
df<-count(diamonds,cut)
dfggplot(df,aes(cut,n,label=n))+
geom_point(aes(size=n),color=rgb(184,38,33,maxColorValue = 255))+
geom_text(nudge_y = 1000,color='black')+
geom_segment(aes(x=cut,xend=cut,y=0,yend=n),color="#B82621")+
theme_bw()+
labs(size='number')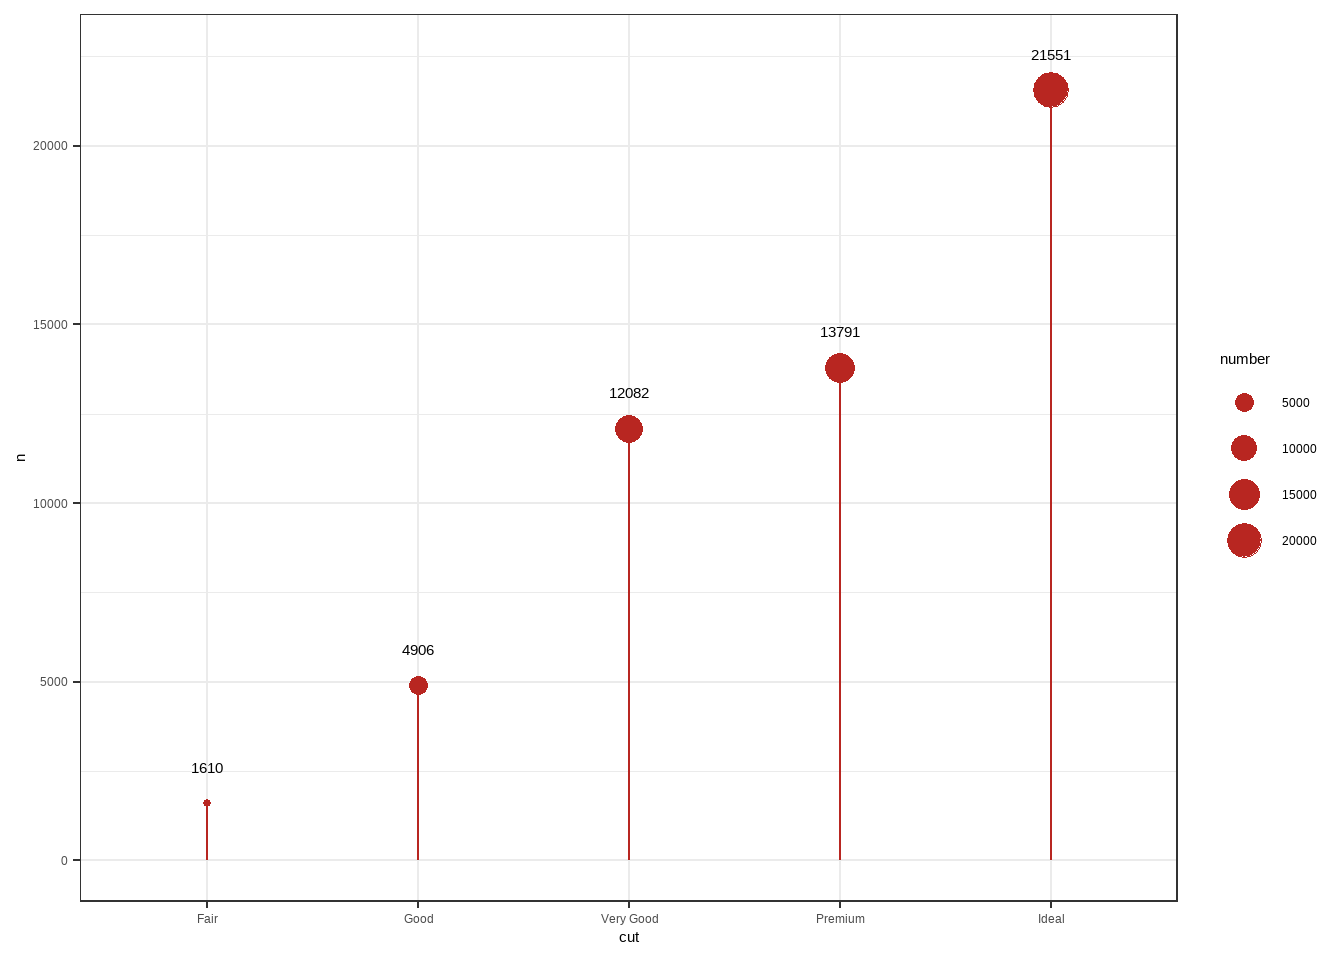
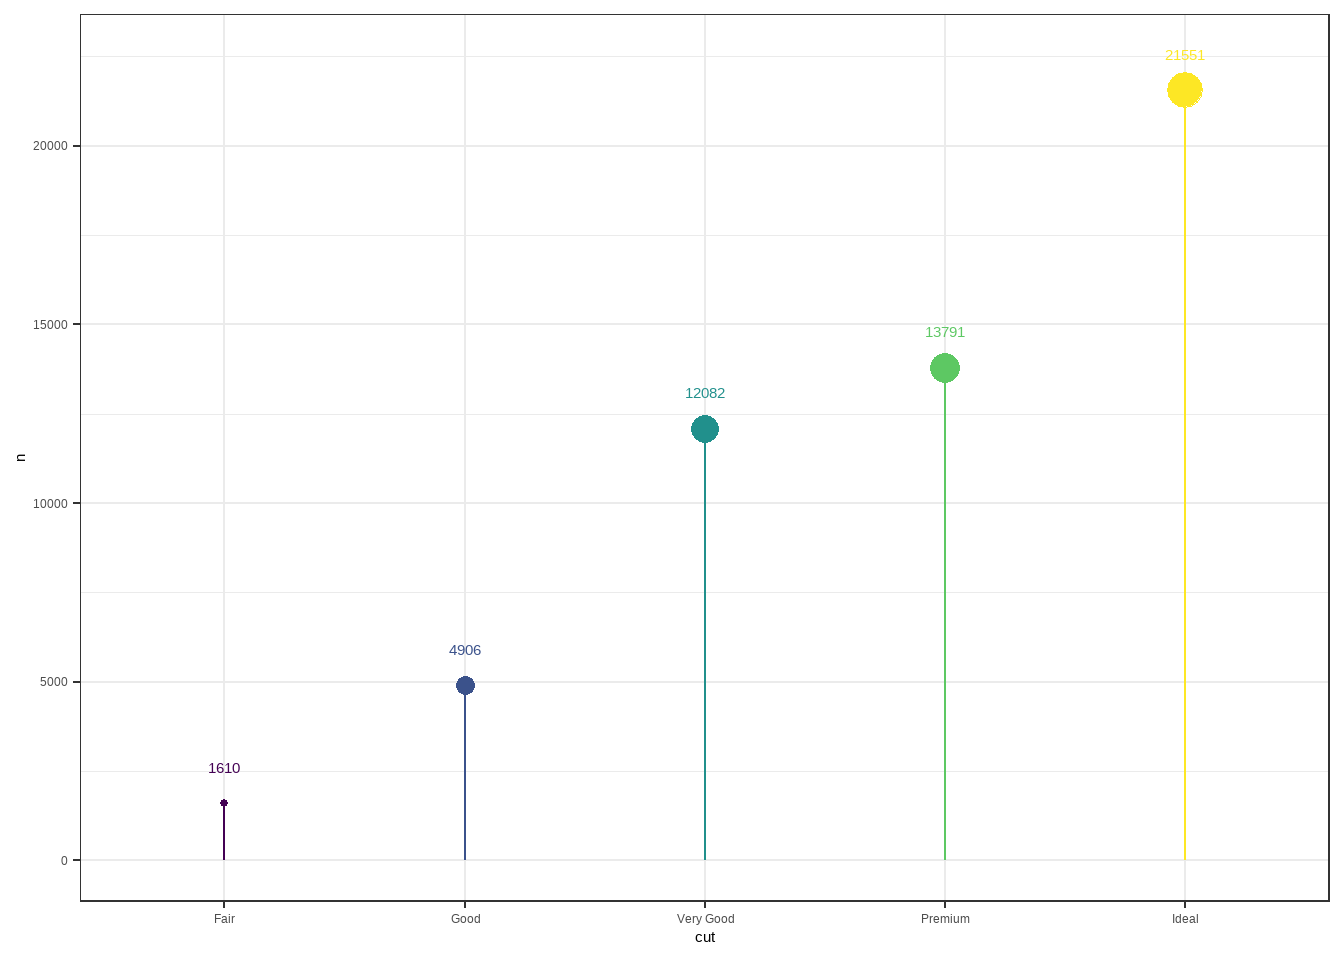
#棒棒糖图
df<-count(diamonds,cut)
dfggplot(df,aes(cut,n,label=n,color=cut))+
geom_point(aes(size=n))+
geom_text(nudge_y = 1000)+
geom_segment(aes(x=cut,xend=cut,y=0,yend=n))+
theme_bw()+
theme(legend.position = 'null')